
Chaos game
我們來看一個簡單的混沌遊戲:
- 在平面上畫出一個三角形,頂點 A, B, C
- 隨機在三角形 ABC 內部選定一點 p0
- 隨機選取任一頂點,並找到 p0 與該頂點的中點,記作 p1
- 再隨機選取任一頂點,找到 p1 與該頂點的中點,記作 p2
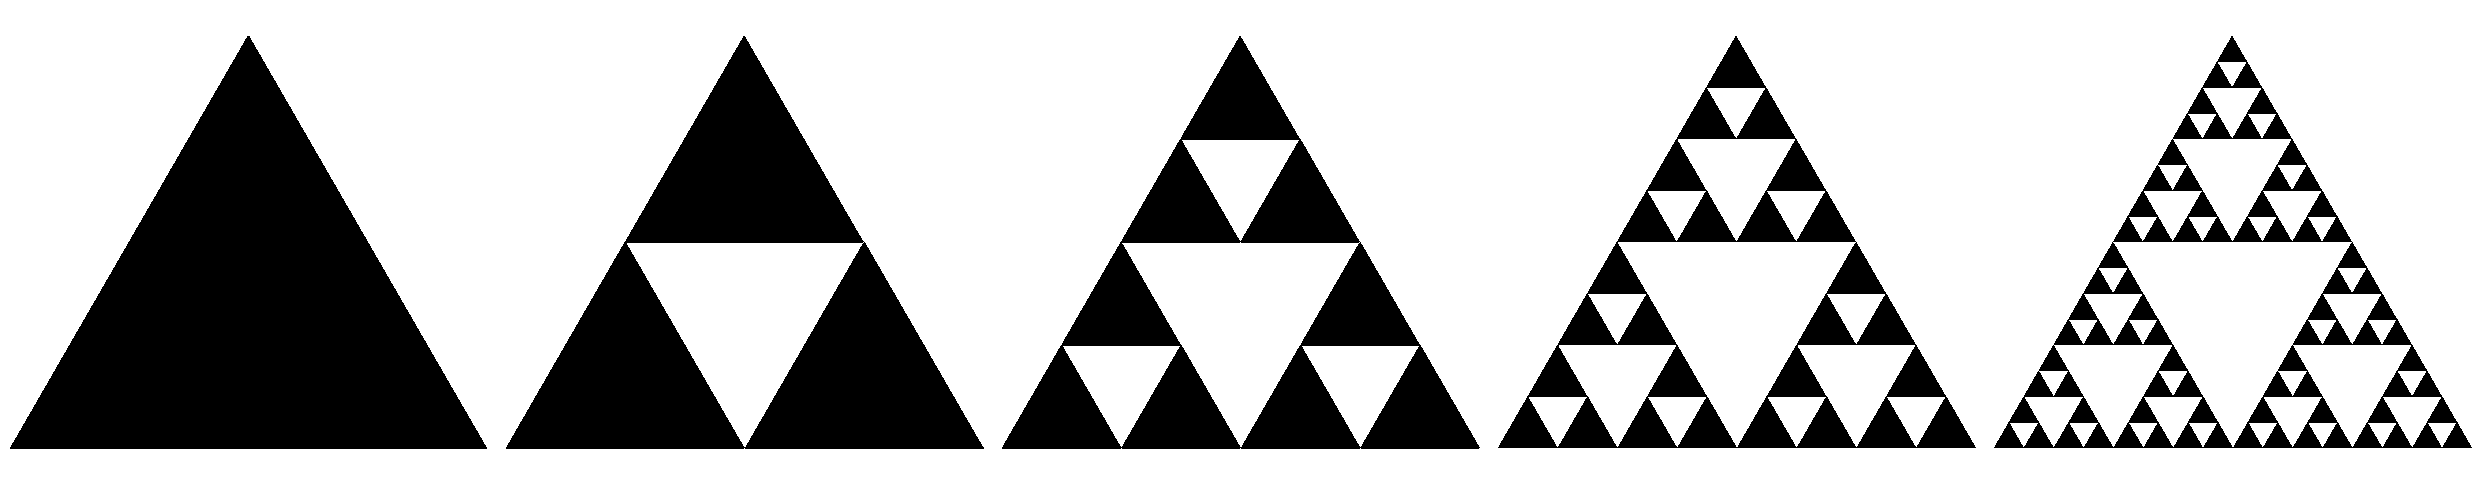
重複以上步驟,並把 p0, p1, p2, … 畫在座標平面上,可以得到近似 Sierpinski triangle 的分形構造
Sierpinski triangle 的演變,引自維基百科
R code
# Sierpinski triangle
triangle <- matrix(c(A = c(-1, 0),
                     B = c(1, 0),
                     C = c(0, sqrt(3)),
                     Aprime = c(-1, 0)),
                   byrow = TRUE,
                   nrow = 4, ncol = 2)
colnames(triangle) <- c("X", "Y")
rownames(triangle) <- c("A", "B", "C", "Aprime")
plot(triangle[,1], triangle[,2], type = 'b')

## sample an initial point inside the triangle ABC

sampleInit <- function(){
  X <- runif(1, min = -1, max = 1)
  Y <- runif(1, min = 0, max = sqrt(3))
  if( (Y >= 0) && (Y <= (sqrt(3)*X + sqrt(3))) && (Y <= -sqrt(3)*X+sqrt(3)) ){
    return(cbind(X, Y))
  } else {
    sampleInit()
  }
}
sampleInit()

### test
graphics.off()
plot(triangle,
     xlim = c(-1, 1), ylim = c(0, sqrt(3)),
     type = "b")
# par(new = TRUE)
points(sampleInit(),
     xlim = c(-1, 1), ylim = c(0, sqrt(3)),
     col = "red")

## rules
### a three-sided dice
diceRoll <- function(){
  return(sample(c("A", "B", "C"), size = 1, prob = c(1/3, 1/3, 1/3)))
}

## path
stepTrace <- as.data.frame(sampleInit())
move <- function(diceOutCome, stepTrace){
  lastStep <- tail(stepTrace, 1)
  if(diceOutCome == "A"){
    X <- (-1 + lastStep[,1])/2
    Y <- (0 + lastStep[,2])/2
  } else if(diceOutCome == "B"){
    X <- (1 + lastStep[,1])/2
    Y <- (0 + lastStep[,2])/2
  } else if(diceOutCome == "C"){
    X <- (0 + lastStep[,1])/2
    Y <- (sqrt(3) + lastStep[,2])/2
  }
  lastStep <- cbind(X, Y)
  stepTrace <- rbind(stepTrace, lastStep)
  return(stepTrace)
}

run <- function(n_run = 100){
  stepTrace <- as.data.frame(sampleInit())
  for(i in 1:n_run){
    stepTrace <- move(diceRoll(), stepTrace)
  }
  return(stepTrace)
}
df <- run(10000)
plot(df, pch = 16)

# animation
runAnimation <- function(n_run = 100){
  stepTrace <- as.data.frame(sampleInit())
  plot(triangle, type = 'b', pch = 15,
       xlim = c(-1, 1), ylim = c(0, sqrt(3)))
  points(stepTrace, col = 'red', pch = 15)
  for(i in 1:n_run){
    stepTrace <- move(diceRoll(), stepTrace)
    points(stepTrace[-1,],
           xlim = c(-1, 1), ylim = c(0, sqrt(3)),
           col = "blue", pch = 15)
    Sys.sleep(0.1)
  }
  return(stepTrace)
}
runAnimation(1000)
模擬後的結果
